
College Enrollment & Student Demographic Statistics
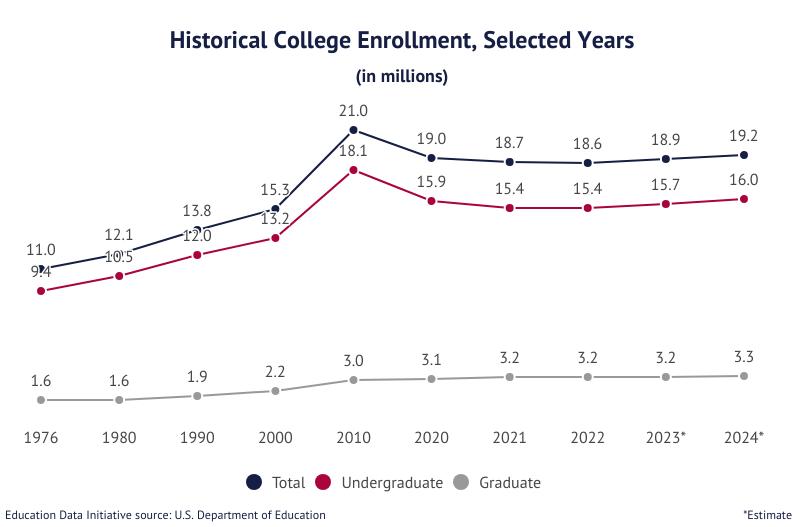
Report Highlights. College enrollment totaled 19.28 million undergraduate students nationwide in Fall 2024, down 8.43% from peak enrollment in 2010 (21.0 million).
- Projections indicate slightly higher enrollment for Fall 2025 undergraduate enrollment (19.57 million).
- 82.9% of postsecondary students are undergraduates; the remaining 17.1% are in graduate programs.
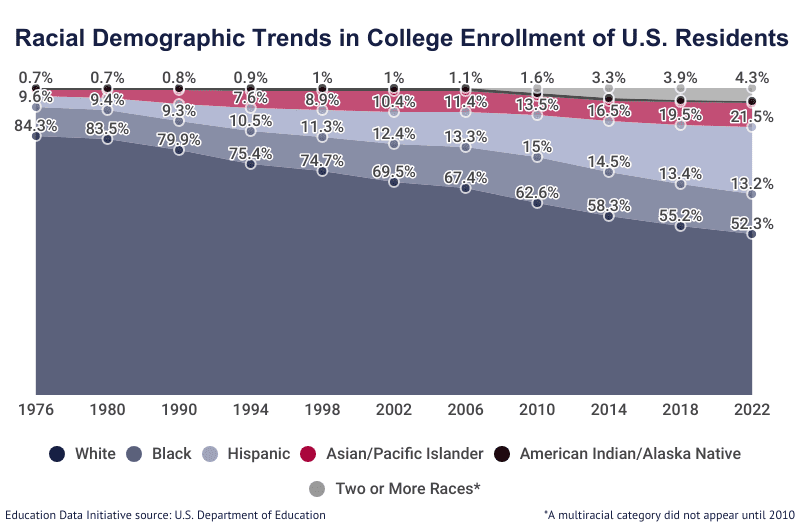
- 20.3% of the student population is Hispanic or Latino, up 483% since 1976.
- The number of female college attendees has doubled since 1976; as a share of total students, female representation has increased 22.6%.
A further 377,164 students attend postsecondary institutions that do not, at the time of publication, grant degrees. Students at these institutions are excluded from this report unless noted otherwise. When including these students, the nationwide total number of postsecondary students enrolled in Fall 2024 climbs to 19.625 million.
Related research reports include Student Loan Debt Statistics | College Graduation Statistics | College Dropout Rates | Average Cost of College | Student Loan Refinancing
Jump to a state: AL | AK | AZ | AR | CA | CO | CT | DE | DC | FL | GA | HI | ID | IL | IN | IA | KS | KY | LA | ME | MD | MA | MI | MN | MS | MO | MT | NE | NV | NH | NJ | NM | NY | NC | ND | OH | OK | OR | PA | RI | SC | SD | TN | TX | UT | VT | VA | WA | WV | WI | WY
College Enrollment Statistics
College enrollment statistics indicate that more Americans are forgoing higher education; some may be putting off college attendance to build savings.
- Postsecondary enrollment peaked in 2010 at 21.02 million.
- 11.91 million undergraduates and graduate students are enrolled full-time, representing 60.7% of postsecondary students.
- 62.0% of high school (or equivalent) graduates go on to postsecondary study.
- Enrollment among new high school graduates has declined 11.6% since its peak in 2009 (70.1%).
- In 1960, 45.1% of new high school graduates were enrolled in college.
- Among first-time, first-year college students, 82.7% are full-time students.
- As many as 7.21% of American adults are enrolled in college as part-time or full-time students.
- 73.2% of college students at all education levels attend public institutions.
- Among the 5.16 million undergraduates who attend private institutions, approximately 78.4% attend nonprofit schools.
- 49.2% of graduate students attend public institutions.
- 61.7% of undergraduates are full-time or full-time equivalent (FTE) students.
- In the 2022-2023 academic year, 1.06 million enrolled college students (5.69%) were internationals.
*Estimate/projection
College Enrollment by Degree
College enrollment statistics indicate that, whether they earn their degree or drop out, most undergraduate students make only one attempt to complete their college education.
- 5.37% of undergraduates enrolled in 4-year institutions in Fall 2024 are declared business majors, making it the most popular bachelor’s degree.
- Other popular majors among students enrolled in 4-year institutions for Fall 2024 include:
- Liberal arts and sciences (3.84%)
- Computer science and technology (3.46%)
- Engineering (3.33%)
- 15.0% of undergraduates enrolled in 2-year institutions in Fall 2024 declared a liberal arts and sciences major.
- Other popular majors among students enrolled in 2-year institutions for Fall 2024 include:
- Healthcare (7.80%)
- Business (5.15%)
- Computer and information technology (2.38%)
- 11.8% of graduate students enrolled in Fall 2024 sought advanced degrees in healthcare.
- Other popular fields of study among graduate students enrolled in Fall 2024 include:
- Business (7.21%)
- Education (6.76%)
- Computer and information technology (3.49%)
College Enrollment by Institution Type
A majority of postsecondary students enroll full-time in degree-granting 4-year public institutions.
- Among new high school graduates, 16.9% enroll in 2-year colleges; 45.1% enroll in 4-year programs.
- 74.9% of all undergraduate college students enrolled in 4-year institutions.
- Among those enrolled in 4-year institutions, 69.5% enroll full-time.
- 72.6% of undergraduates enroll in public institutions.
- Among public institution enrollees, 67.0% enroll in 4-year programs.
- Most students who enroll in private institutions (80.3%) attend 4-year nonprofits.
College Enrollment by Sex
Limited data makes no significant representation of genders beyond the standard binary. Updates to data collection policies may make these statistics available in the future.
- 42.7% of enrolled undergraduate students are male; 57.3% are female.
- 78.4% of male and 76.5% of female college students attend public institutions.
- Among college students enrolled in public schools, 56.7% are female.
- 39.0% of enrolled graduate students are male; 61.0% are female.
- Among all postsecondary students, graduate and undergraduate, 42.1% are male and 57.9% are female.
- In 1970, 41.2% of college students were female, up from 29.0% in 1949.
- 34.2% of American males aged 18 to 24 years are enrolled in college or graduate school.
- 43.8% of American females aged 18 to 24 years are enrolled in college or graduate school.
- Among first-time, full-time bachelor’s degree-seekers, females are 32.3% more likely to complete their degree at the first institution they enrolled in and within six (6) years compared to men.
- 58.5% of bachelor’s degrees are conferred to females.
- 62.6% of associate’s degrees and 62.8% of master’s degrees are conferred to women.
College Enrollment by Race or Ethnicity
Demographic statistics are imperfect because many people do not fit easily into just one category. Not all races are represented and some historical data use obsolete definitions and terminology. The language of this report conforms to the language used in available data sets.
- 52.3% of college students are White or Caucasian; excluding nonresident noncitizens or international students.
- 58.9% of White or Caucasian students enroll at 4-year institutions.
- As a percentage of total student enrollments, the rate of enrollment of students of color has increased from 15.36% in 1976 to 45.23% in 2022, an absolute increase of 29.87%.
- Black and African American student enrolment has seen an absolute increase of 3.1% since 1976 relative to total enrollment.
- 21.18% of postsecondary students were white males in Fall 2022.
- 18.03% of graduate students were white males in Fall 202.
- Enrollment among Hispanic females has seen an absolute increase of 10.61% from 1976 to 2022 relative to total enrollment.
- American Indians and Alaska Natives had a low absolute increase of enrollment relative to total enrollments, increasing by 0.043% since 1976.
- The absolute increase in enrollment of American Indian and Alaska Native students in graduate programs is similarly low, increasing by 0.012% since 1976.
American Indian or Alaska Native Enrollment
Postsecondary attendance among American Indian or Alaska Native students was in decline between 2012 and 2021.
- 0.69% of students identify as American Indian or Alaska Native.
- Attendance among students of this demographic has increased 56.1% relative to 1976.
- American Indian or Alaska Native students saw their highest rate of attendance in 2007 (1.08%).
- 77.37% of students in this demographic attend public institutions.
- 64.74% of American Indian or Alaska Native students attend 4-year institutions.
Asian or Asian American Enrollment
Postsecondary attendance among Asian or Asian American students has steadily grown since 2010; attendance rates prior to 2010 combine Asian and Pacific Islander student populations.
- 7.39% of students identify as Asian or Asian American.
- Attendance among students of this demographic has increased 12.6% relative to 2010.
- 74.3% of Asians or Asian American attend public institutions.
- 78.77% of Asian or Asian American students attend 4-year institutions.
Black or African-American Enrollment
Postsecondary attendance among Black or African American students was on the rise until 2010; since then, it has been in decline.
- 13.2% of students identify as Black or African American.
- Attendance among students of this demographic has increased by 124.9% relative to 1976.
- 67.58% of students in this demographic attend public institutions.
- 71.88% of Black or African American students attend 4-year institutions.
Hispanic or Latino Enrollment
Postsecondary attendance among Hispanic or Latino students has skyrocketed in the last 50 years and continues to grow annually.
- 21.46% of the college student population identifies as Hispanic or Latino.
- Attendance among this demographic has increased by 884% relative to 1976.
- 80.4% of students in this demographic attend public institutions.
- 66.1% of Hispanic or Latino students enroll in 4-year colleges.
Pacific Islander Enrollment
As with the Asian or Asian American category, attendance rates prior to 2010 combined Asian and Pacific Islander student populations.
- 0.25% of the college student population identifies as Pacific Islander.
- Attendance among this demographic has declined by 30.6% relative to 2010.
- 62.8% of students in this demographic attend public institutions.
- 70.3% of Pacific Islander students enrolled in 4-year colleges.
Multiracial Enrollment
Students who identify as two or more races are categorized as multiracial. Data prior to 2010 is unavailable.
- 4.34% of the college student population identifies as multiracial.
- Attendance among multiracial students has increased by 135% relative to 2010.
- 74.3% of students in this demographic attend public institutions.
- 74.8% of multiracial students enroll in 4-year colleges.
U.S. Nonresident Enrollment
The phrase US nonresident is defined as “A person who is not a citizen or national of the United States and who is in the United States on a visa or temporary basis and does not have the right to remain indefinitely”.
- 5.2% of enrolled college students are nonresident non-citizens.
- The attendance rate among these students increased 9.3% YoY.
- Attendance among these students has increased by 342.6% relative to 1976.
- Since 2010, attendance is up 36.8%.
- 58.4% of students in this demographic attend public institutions.
- 94.2% of nonresident, non-citizen students enroll in 4-year colleges.
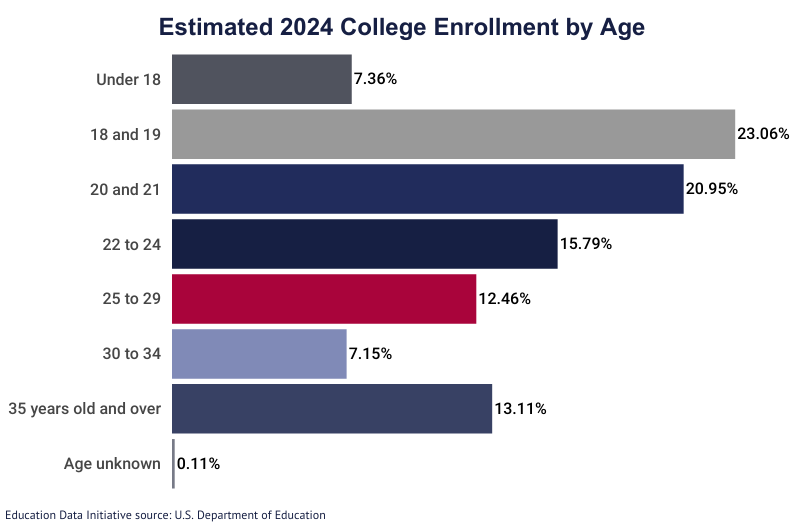
College Enrollment by Age
Most college students first enroll in their late teens as full-time students. Part-time students are more likely to be older.
- Among Americans aged 25 years and older, 37.7% have a bachelor’s degree or higher.
- 67.2% of college students are projected to be aged 24 years and under in 2024.
- 39% of American 18- to 24-year-olds are enrolled in college or graduate school.
- 26.84% of all enrolled students are aged 18 to 19 years old.
- 38.52% of all enrolled students are aged 20 to 24 years old.
- 9.19% of all enrolled students are aged 25 to 29 years old.
- 5.71% of all enrolled students are aged 30 to 34 years old.
- 3.72% of all enrolled students are aged 35 to 39 years old.
- 4.1% of all enrolled students are aged 40 to 49 years old.
- People aged 50 to 64 years make up 1.92% of all enrolled students.
- 2.18% of all enrolled students are aged 50 and over.
- Students enrolled in Fall 2022 were 10.5% more likely to be between the ages of 18 and 24 than students enrolled in Fall 2005.
College-Bound High School Graduates
The percentage of high school graduates (referred to sometimes as completers) who enroll in either 2-year or 4-year institutions following graduation is referred to as the “immediate college enrollment rate”.
- In Spring 2022, 2.99 million students graduated from high school, a 7% decline relative to the Class of 2018 (the largest graduating class).
- 62% of the Class of 2022 enrolled in postsecondary institutions in Fall 2023.
- Among the Class of 2022, 16.9% enrolled in 2-year institutions in Fall 2023.
- 45.1% of the Class of 2022 enrolled in 4-year institutions.
- Among males who graduated high school in 2022, 57.2% immediately enrolled in college.
- Females in the Class of 2022 had a 66% immediate matriculation rate.
- Among the Class of 2022, female students were 94.1% more likely to immediately matriculate.
- 2022 female high school graduates were 65% more likely to immediately enroll in 4-year institutions compared to graduating males.
- Among immediately college-bound members of the Class of 2021, female students were 86.4% more likely to attend 4-year institutions compared to males.
State College Enrollment Statistics
College enrollment statistics indicate that many students are willing to travel out of their home state for their college education.
- California has the highest number of enrolled college students at 2.487 million, a 97.8% increase relative to 1970.
- New York and Texas are the only other states with more than a million college students enrolled.
- Alaska has the smallest student population with 22,152 students enrolled; that’s a 112.7% increase relative to 1970.
- Wyoming, Montana, and Vermont all have fewer than 50,000 enrolled college students.
- New Hampshire, Utah, and Idaho have seen the largest increases in enrollment rates relative to 2010 at 184.01%, 56.94%, and 47% respectively.
- 45 states have seen a decline in postsecondary enrollment since 2010.
- Iowa and Alaska saw the largest declines in enrollment since 2010, losing 47% and 42.1% of their respective student populations
- The only jurisdictions to see an increase in the number of students enrolled since 2010 are New Hampshire, Utah, Idaho, Delaware, and Texas, as well as the District of Columbia.
- New Hampshire and Utah had the largest YoY student population growth at 8.1% and 2.87%, respectively.
College Enrollment in Alabama
Among students enrolled full-time in Alabama postsecondary institutions, 68.3% are state residents and 31.7% are nonresidents.
- 294,009 students are enrolled in Alabama colleges.
- Enrollment in Alabama has declined by 10.8% since 2010.
- Between 1970 and 2010, enrollment in Alabama increased by 215.2%.
- 57.9% of full-time students in Alabama are female.
- 86.1% of students enrolled in Alabama postsecondary institutions attend public schools.
- Among all Alabama residents enrolled in college, 14.6% leave the state to attend school.
College Enrollment in Alaska
Among students enrolled full-time in Alaska postsecondary institutions, 86.7% are state residents and 13.3% are nonresidents.
- 20,152 students are enrolled in Alaska colleges.
- Enrollment in Alaska has declined 42.1% since 2010.
- Between 1970 and 2010, enrollment increased 267.4%.
- 57.2% of full-time students in Alaska are female.
- 95.1% of students enrolled in Alaska postsecondary institutions attend public schools.
- Among all Alaska residents enrolled in college, 51.3% leave the state to attend school.
College Enrollment in Arizona
Among students enrolled full-time in Arizona postsecondary institutions, 60.3% are state residents and 39.7% are nonresidents.
- 624,719 students are enrolled in Arizona colleges.
- Enrollment in Arizona has declined 21.3% since 2010.
- Between 1970 and 2010, enrollment increased 624.2%.
- 60.4% of full-time students in Arizona are female.
- 60.2% of students enrolled in Arizona postsecondary institutions attend public schools.
- Among all Arizona residents enrolled in college, 14.7% leave the state to attend school.
College Enrollment in Arkansas
Among students enrolled full-time in Arkansas postsecondary institutions, 68.3% are state residents and 31.7% are nonresidents.
- 154,781 students are enrolled in Arkansas colleges.
- Enrollment in Arkansas has declined by 12% since 2010.
- Between 1970 and 2010, enrollment increased 237.9%.
- 58.6% of full-time students in Arkansas are female.
- 89.5% of students enrolled in Arkansas postsecondary institutions attend public schools.
- Among all Arkansas residents enrolled in college, 17.3% leave the state to attend school.
College Enrollment in California
Among students enrolled full-time in California postsecondary institutions, 88.8% are state residents and 112% are nonresidents.
- 2,486,788 students are enrolled in California colleges.
- Enrollment in California has declined by 8.4% since 2010.
- Between 1970 and 2010, enrollment increased 115.9%.
- 57.3% of full-time students in California are female.
- 81.7% of students enrolled in California postsecondary institutions attend public schools.
- Among all California residents enrolled in college, 12.5% leave the state to attend school.
College Enrollment in Colorado
Among students enrolled full-time in Colorado postsecondary institutions, 66.3% are state residents and 33.7% are nonresidents.
- 346,716 students are enrolled in Colorado colleges.
- Enrollment in Colorado has declined by 6.2% since 2010.
- Between 1970 and 2010, enrollment increased by 199.4%.
- 56.1% of full-time students in Colorado are female.
- 77.6% of students enrolled in Colorado postsecondary institutions attend public schools.
- Among all Colorado residents enrolled in college, 31.8% leave the state to attend school.
College Enrollment in Connecticut
Among students enrolled full-time in Connecticut postsecondary institutions, 61.4% are state residents and 38.6% are nonresidents.
- 187,764 students are enrolled in Connecticut colleges.
- Enrollment in Connecticut has declined by 5.8% since 2010.
- Between 1970 and 2010, enrollment increased 59.9%.
- 57.2% of full-time students in Connecticut are female.
- 51.3% of students enrolled in Connecticut postsecondary institutions attend public schools.
- Among all Connecticut residents enrolled in college, 43.5% leave the state to attend school.
College Enrollment in Delaware
Among students enrolled full-time in Delaware postsecondary institutions, 50.5% are state residents and 49.5% are nonresidents.
- 57,022 students are enrolled in Delaware colleges.
- Enrollment in Delaware has increased by 3.2% since 2010.
- Between 1970 and 2010, enrollment increased by 118.8%.
- 59.4% of full-time students in Delaware are female.
- 72.9% of students enrolled in Delaware postsecondary institutions attend public schools.
- Among all Delaware residents enrolled in college, 27.1% leave the state to attend school.
College Enrollment in the District of Columbia
Among students enrolled full-time in D.C. postsecondary institutions, 6.9% are D.C. residents and 93.1% are nonresidents.
- 99,329 students are enrolled in D.C. colleges.
- Enrollment in D.C. has increased by 8% since 2010.
- Between 1970 and 2010, enrollment increased 19.2%.
- 62.1% of full-time students in D.C. are female.
- 3.6% of students enrolled in D.C. postsecondary institutions attend public schools.
- Among all D.C. residents enrolled in college, 78.1% leave the state to attend school.
College Enrollment in Florida
Among students enrolled full-time in Florida postsecondary institutions, 79.4% are state residents and 20.6% are nonresidents.
- 999,223 students are enrolled in Florida colleges.
- Enrollment in Florida has declined by 11.2% since 2010.
- Between 1970 and 2010, enrollment increased 377.6%.
- 57.3% of full-time students in Florida are female.
- 73.6% of students enrolled in Florida postsecondary institutions attend public schools.
- Among all Florida residents enrolled in college, 15.2% leave the state to attend school.
College Enrollment in Georgia
Among students enrolled full-time in Georgia postsecondary institutions, 79.9% are state residents and 20.1% are nonresidents.
- 541,594 students are enrolled in Georgia colleges.
- Enrollment in Georgia has declined by 4.8% since 2010.
- Between 1970 and 2010, enrollment increased 349.7%.
- 59% of full-time students in Georgia are female.
- 80.5% of students enrolled in Georgia postsecondary institutions attend public schools.
- Among all Georgia residents enrolled in college, 23.8% leave the state to attend school.
College Enrollment in Hawaii
Among students enrolled full-time in Hawaii postsecondary institutions, 66.7% are state residents and 33.3% are nonresidents.
- 58,841 students are enrolled in Hawaii colleges.
- Enrollment in Hawaii has declined by 24.6% since 2010.
- Between 1970 and 2010, enrollment increased by 113.5%.
- 62.8% of full-time students in Hawaii are female.
- 82.2% of students enrolled in Hawaii postsecondary institutions attend public schools.
- Among all Hawaii residents enrolled in college, 42.4% leave the state to attend school.
College Enrollment in Idaho
Among students enrolled full-time in Idaho postsecondary institutions, 60.3% are state residents and 39.7% are nonresidents.
- 125,249 students are enrolled in Idaho colleges.
- Enrollment in Idaho has increased 47% since 2010.
- Between 1970 and 2010, enrollment increased 146.5%.
- 55.4% of full-time students in Idaho are female.
- 62.5% of students enrolled in Idaho postsecondary institutions attend public schools.
- Among all Idaho residents enrolled in college, 28.7% leave the state to attend school.
College Enrollment in Illinois
Among students enrolled full-time in Illinois postsecondary institutions, 79.9% are state residents and 20.1% are nonresidents.
- 677,446 students are enrolled in Illinois colleges.
- Enrollment in Illinois has declined 25.4% since 2010.
- Between 1970 and 2010, enrollment increased by 100.6%.
- 55.6% of full-time students in Illinois are female.
- 61.6% of students enrolled in Illinois postsecondary institutions attend public schools.
- Among all Illinois residents enrolled in college, 32.9% leave the state to attend school.
College Enrollment in Indiana
Among students enrolled full-time in Indiana postsecondary institutions, 67.2% are state residents and 32.8% are nonresidents.
- 436,234 students are enrolled in Indiana colleges.
- Enrollment in Indiana has declined by 5.1% since 2010.
- Between 1970 and 2010, enrollment increased 138.5%.
- 54.6% of full-time students in Indiana are female.
- 80.0% of students enrolled in Indiana postsecondary institutions attend public schools.
- Among all Indiana residents enrolled in college, 16.3% leave the state to attend school.
College Enrollment in Iowa
Among students enrolled full-time in Iowa postsecondary institutions, 64.3% are state residents and 35.7% are nonresidents.
- 202,287 students are enrolled in Iowa colleges.
- Enrollment in Iowa has declined 47% since 2010.
- Between 1970 and 2010, enrollment increased 250.7%.
- 52% of full-time students in Iowa are female.
- 74.6% of students enrolled in Iowa postsecondary institutions attend public schools.
- Among all Iowa residents enrolled in college, 15.2% leave the state to attend school.
College Enrollment in Kansas
Among students enrolled full-time in Kansas postsecondary institutions, 69.4% are state residents and 30.6% are nonresidents.
- 185,985 students are enrolled in Kansas colleges.
- Enrollment in Kansas has declined by 13.4% since 2010.
- Between 1970 and 2010, enrollment increased 109.6%.
- 53% of full-time students in Kansas are female.
- 87.7% of students enrolled in Kansas postsecondary institutions attend public schools.
- Among all Kansas residents enrolled in college, 19.4% leave the state to attend school.
College Enrollment in Kentucky
Among students enrolled full-time in Kentucky postsecondary institutions, 77% are state residents and 23% are nonresidents.
- 261,751 students are enrolled in Kentucky colleges.
- Enrollment in Kentucky has declined by 10.1% since 2010.
- Between 1970 and 2010, enrollment increased 195.3%.
- 59.7% of full-time students in Kentucky are female.
- 74.2% of students enrolled in Kentucky postsecondary institutions attend public schools.
- Among all Kentucky residents enrolled in college, 16.7% leave the state to attend school.
College Enrollment in Louisiana
Among students enrolled full-time in Louisiana postsecondary institutions, 79.1% are state residents and 20.9% are nonresidents.
- 238,689 students are enrolled in Louisiana colleges.
- Enrollment in Louisiana has declined 9.5% since 2010.
- Between 1970 and 2010, enrollment increased 118.4%.
- 60.6% of full-time students in Louisiana are female.
- 86.8% of students enrolled in Louisiana postsecondary institutions attend public schools.
- Among all Louisiana residents enrolled in college, 15.9% leave the state to attend school.
College Enrollment in Maine
Among students enrolled full-time in Maine postsecondary institutions, 61.7% are state residents and 38.3% are nonresidents.
- 71,475 students are enrolled in Maine colleges.
- Enrollment in Maine has declined by 1.3% since 2010.
- Between 1970 and 2010, enrollment increased 112.1%.
- 57.9% of full-time students in Maine are female.
- 65.5% of students enrolled in Maine postsecondary institutions attend public schools.
- Among all Maine residents enrolled in college, 28.4% leave the state to attend school.
College Enrollment in Maryland
Among students enrolled full-time in Maryland postsecondary institutions, 77.3% are state residents and 22.7% are nonresidents.
- 329,092 students are enrolled in Maryland colleges.
- Enrollment in Maryland has declined by 12.9% since 2010.
- Between 1970 and 2010, enrollment increased 152.6%.
- 55.4% of full-time students in Maryland are female.
- 81.7% of students enrolled in Maryland postsecondary institutions attend public schools.
- Among all Maryland residents enrolled in college, 36.6% leave the state to attend school.
College Enrollment in Massachusetts
Among students enrolled full-time in Massachusetts postsecondary institutions, 55.7% are state residents and 44.3% are nonresidents.
- 468,960 students are enrolled in Massachusetts colleges.
- Enrollment in Massachusetts has declined by 7.6% since 2010.
- Between 1970 and 2010, enrollment increased 67.1%.
- 55.8% of full-time students in Massachusetts are female.
- 38.3% of students enrolled in Massachusetts postsecondary institutions attend public schools.
- Among all Massachusetts residents enrolled in college, 37.7% leave the state to attend school.
College Enrollment in Michigan
Among students enrolled full-time in Michigan postsecondary institutions, 83.5% are state residents and 16.5% are nonresidents.
- 466,458 students are enrolled in Michigan colleges.
- Enrollment in Michigan has declined 33.1% since 2010.
- Between 1970 and 2010, enrollment increased by 77.7%.
- 55% of full-time students in Michigan are female.
- 87.1% of students enrolled in Michigan postsecondary institutions attend public schools.
- Among all Michigan residents enrolled in college, 14% leave the state to attend school.
College Enrollment in Minnesota
Among students enrolled full-time in Minnesota postsecondary institutions, 77.9% are state residents and 22.1% are nonresidents.
- 373,128 students are enrolled in Minnesota colleges.
- Enrollment in Minnesota has declined by 19.8% since 2010.
- Between 1970 and 2010, enrollment increased 189.5%.
- 59.7% of full-time students in Minnesota are female.
- 59.8% of students enrolled in Minnesota postsecondary institutions attend public schools.
- Among all Minnesota residents enrolled in college, 34.7% leave the state to attend school.
College Enrollment in Mississippi
Among students enrolled full-time in Mississippi postsecondary institutions, 72.5% are state residents and 27.5% are nonresidents.
- 155,950 students are enrolled in Mississippi colleges.
- Enrollment in Mississippi has declined by 13.4% since 2010.
- Between 1970 and 2010, enrollment increased by 143.3%.
- 60.1% of full-time students in Mississippi are female.
- 89% of students enrolled in Mississippi postsecondary institutions attend public schools.
- Among all Mississippi residents enrolled in college, 13% leave the state to attend school.
College Enrollment in Missouri
Among students enrolled full-time in Missouri postsecondary institutions, 75% are state residents and 25% are nonresidents.
- 333,470 students are enrolled in Missouri colleges.
- Enrollment in Missouri has declined by 25.0% since 2010.
- Between 1970 and 2010, enrollment increased 141.8%.
- 56.2% of full-time students in Missouri are female.
- 63.1% of students enrolled in Missouri postsecondary institutions attend public schools.
- Among all Missouri residents enrolled in college, 23.9% leave the state to attend school.
College Enrollment in Montana
Among students enrolled full-time in Montana postsecondary institutions, 54.6% are state residents and 45.4% are nonresidents.
- 47,134 students are enrolled in Montana colleges.
- Enrollment in Montana has declined by 11.5% since 2010.
- Between 1970 and 2010, enrollment increased 77.2%.
- 53% of full-time students in Montana are female.
- 92.4% of students enrolled in Montana postsecondary institutions attend public schools.
- Among all Montana residents enrolled in college, 28.6% leave the state to attend school.
College Enrollment in Nebraska
Among students enrolled full-time in Nebraska postsecondary institutions, 74% are state residents and 26% are nonresidents.
- 134,815 students are enrolled in Nebraska colleges.
- Enrollment in Nebraska has declined by 6.8% since 2010.
- Between 1970 and 2010, enrollment increased 116.2%.
- 55.7% of full-time students in Nebraska are female.
- 72.8% of students enrolled in Nebraska postsecondary institutions attend public schools.
- Among all Nebraska residents enrolled in college, 24.9% leave the state to attend school.
College Enrollment in Nevada
Among students enrolled full-time in Nevada postsecondary institutions, 89.5% are state residents and 10.5% are nonresidents.
- 113,588 students are enrolled in Nevada colleges.
- Enrollment in Nevada has declined by 12.2% since 2010.
- Between 1970 and 2010, enrollment increased 846.4%.
- 59.4% of full-time students in Nevada are female.
- 91.7% of students enrolled in Nevada postsecondary institutions attend public schools.
- Among all Nevada residents enrolled in college, 26% leave the state to attend school.
College Enrollment in New Hampshire
Among students enrolled full-time in New Hampshire postsecondary institutions, 21.4% are state residents and 78.6% are nonresidents.
- 214,537 students are enrolled in New Hampshire colleges.
- Enrollment in New Hampshire has increased 184% since 2010.
- Between 1970 and 2010, enrollment increased 156.9%.
- 58.6% of full-time students in New Hampshire are female.
- 15.1% of students enrolled in New Hampshire postsecondary institutions attend public schools.
- Among all New Hampshire residents enrolled in college, 50.1% leave the state to attend school.
College Enrollment in New Jersey
Among students enrolled full-time in New Jersey postsecondary institutions, 88.7% are state residents and 11.3% are nonresidents.
- 378,819 students are enrolled in New Jersey colleges.
- Enrollment in New Jersey has declined 14.7% since 2010.
- Between 1970 and 2010, enrollment increased by 105.5%.
- 52.8% of full-time students in New Jersey are female.
- 77.9% of students enrolled in New Jersey postsecondary institutions attend public schools.
- Among all New Jersey residents enrolled in college, 39.2% leave the state to attend school.
College Enrollment in New Mexico
Among students enrolled full-time in New Mexico postsecondary institutions, 82.7% are state residents and 17.3% are nonresidents.
- 110,082 students are enrolled in New Mexico colleges.
- Enrollment in New Mexico has declined by 32.3% since 2010.
- Between 1970 and 2010, enrollment increased by 265.6%.
- 59.2% of full-time students in New Mexico are female.
- 96.4% of students enrolled in New Mexico postsecondary institutions attend public schools.
- Among all New Mexico residents enrolled in college, 18.7% leave the state to attend school.
College Enrollment in New York
Among students enrolled full-time in New York postsecondary institutions, 73.9% are state residents and 26.1% are nonresidents.
- 1,117,623 students are enrolled in New York colleges.
- Enrollment in New York has declined by 14.4% since 2010.
- Between 1970 and 2010, enrollment increased 61.8%.
- 56.4% of full-time students in New York are female.
- 52% of students enrolled in New York postsecondary institutions attend public schools.
- Among all New York residents enrolled in college, 22.9% leave the state to attend school.
College Enrollment in North Carolina
Among students enrolled full-time in North Carolina postsecondary institutions, 78.6% are state residents and 21.4% are nonresidents.
- 553,180 students are enrolled in North Carolina colleges.
- Enrollment in North Carolina has declined by 5.6% since 2010.
- Between 1970 and 2010, enrollment increased by 240.7%.
- 57.9% of full-time students in North Carolina are female.
- 82.3% of students enrolled in North Carolina postsecondary institutions attend public schools.
- Among all North Carolina residents enrolled in college, 15.7% leave the state to attend school.
College Enrollment in North Dakota
Among students enrolled full-time in North Dakota postsecondary institutions, 49.5% are state residents and 50.5% are nonresidents.
- 51,074 students are enrolled in North Dakota colleges.
- Enrollment in North Dakota has declined by 10.2% since 2010.
- Between 1970 and 2010, enrollment increased by 80.7%.
- 51.7% of full-time students in North Dakota are female.
- 86.7% of students enrolled in North Dakota postsecondary institutions attend public schools.
- Among all North Dakota residents enrolled in college, 26.7% leave the state to attend school.
College Enrollment in Ohio
Among students enrolled full-time in Ohio postsecondary institutions, 75.8% are state residents and 24.2% are nonresidents.
- 612,352 students are enrolled in Ohio colleges.
- Enrollment in Ohio has declined 17.8% since 2010.
- Between 1970 and 2010, enrollment increased by 98%.
- 55.4% of full-time students in Ohio are female.
- 77.2% of students enrolled in Ohio postsecondary institutions attend public schools.
- Among all Ohio residents enrolled in college, 17.4% leave the state to attend school.
College Enrollment in Oklahoma
Among students enrolled full-time in Oklahoma postsecondary institutions, 76% are state residents and 24% are nonresidents.
- 184,218 students are enrolled in Oklahoma colleges.
- Enrollment in Oklahoma has declined by 20.1% since 2010.
- Between 1970 and 2010, enrollment increased 109.3%.
- 56.4% of full-time students in Oklahoma are female.
- 86.6% of students enrolled in Oklahoma postsecondary institutions attend public schools.
- Among all Oklahoma residents enrolled in college, 17.2% leave the state to attend school.
College Enrollment in Oregon
Among students enrolled full-time in Oregon postsecondary institutions, 69.5% are state residents and 30.5% are nonresidents.
- 194,987 students are enrolled in Oregon colleges.
- Enrollment in Oregon has declined by 22.5% since 2010.
- Between 1970 and 2010, enrollment increased by 106%.
- 56.6% of full-time students in Oregon are female.
- 85.4% of students enrolled in Oregon postsecondary institutions attend public schools.
- Among all Oregon residents enrolled in college, 21.8% leave the state to attend school.
College Enrollment in Pennsylvania
Among students enrolled full-time in Pennsylvania postsecondary institutions, 67.1% are state residents and 32.9% are nonresidents.
- 633,991 students are enrolled in Pennsylvania colleges.
- Enrollment in Pennsylvania has declined by 21.2% since 2010.
- Between 1970 and 2010, enrollment increased by 95.8%.
- 55.4% of full-time students in Pennsylvania are female.
- 54.1% of students enrolled in Pennsylvania postsecondary institutions attend public schools.
- Among all Pennsylvania residents enrolled in college, 24% leave the state to attend school.
College Enrollment in Puerto Rico
Among students enrolled full-time in Pennsylvania postsecondary institutions, 67.1% are state residents and 32.9% are nonresidents.
- 633,991 students are enrolled in Pennsylvania colleges.
- Enrollment in Pennsylvania has declined by 21.2% since 2010.
- Between 1970 and 2010, enrollment increased by 95.8%.
- 55.4% of full-time students in Pennsylvania are female.
- 54.1% of students enrolled in Pennsylvania postsecondary institutions attend public schools.
- Among all Pennsylvania residents enrolled in college, 24% leave the state to attend school.
College Enrollment in Rhode Island
Among students enrolled full-time in Rhode Island postsecondary institutions, 39.7% are state residents and 60.3% are nonresidents.
- 74,413 students are enrolled in Rhode Island colleges.
- Enrollment in Rhode Island has declined by 12.6% since 2010.
- Between 1970 and 2010, enrollment increased 85.4%.
- 56.1% of full-time students in Rhode Island are female.
- 47.7% of students enrolled in Rhode Island postsecondary institutions attend public schools.
- Among all Rhode Island residents enrolled in college, 33.2% leave the state to attend school.
College Enrollment in South Carolina
Among students enrolled full-time in South Carolina postsecondary institutions, 70.9% are state residents and 29.1% are nonresidents.
- 242,672 students are enrolled in South Carolina colleges.
- Enrollment in South Carolina has declined by 5.6% since 2010.
- Between 1970 and 2010, enrollment increased 269.8%.
- 57.5% of full-time students in South Carolina are female.
- 83% of students enrolled in South Carolina postsecondary institutions attend public schools.
- Among all South Carolina residents enrolled in college, 16.6% leave the state to attend school.
College Enrollment in South Dakota
Among students enrolled full-time in South Dakota postsecondary institutions, 58.3% are state residents and 41.7% are nonresidents.
- 51,317 students are enrolled in South Dakota colleges.
- Enrollment in South Dakota has declined by 12.1% since 2010.
- Between 1970 and 2010, enrollment increased by 90.5%.
- 52% of full-time students in South Dakota are female.
- 83.3% of students enrolled in South Dakota postsecondary institutions attend public schools.
- Among all South Dakota residents enrolled in college, 26.4% leave the state to attend school.
College Enrollment in Tennessee
Among students enrolled full-time in Tennessee postsecondary institutions, 71% are state residents and 29% are nonresidents.
- 308,710 students are enrolled in Tennessee colleges.
- Enrollment in Tennessee has declined by 12.2% since 2010.
- Between 1970 and 2010, enrollment increased 160.4%.
- 59.1% of full-time students in Tennessee are female.
- 68% of students enrolled in Tennessee postsecondary institutions attend public schools.
- Among all Tennessee residents enrolled in college, 20.7% leave the state to attend school.
College Enrollment in Texas
Among students enrolled full-time in Texas postsecondary institutions, 91.9% are state residents and 8.1% are nonresidents.
- 1,567,017 students are enrolled in Texas colleges.
- Enrollment in Texas has increased by 2% since 2010.
- Between 1970 and 2010, enrollment increased 247.3%.
- 56.7% of full-time students in Texas are female.
- 88.4% of students enrolled in Texas postsecondary institutions attend public schools.
- Among all Texas residents enrolled in college, 14.7% leave the state to attend school.
College Enrollment in Utah
Among students enrolled full-time in Utah postsecondary institutions, 63.1% are state residents and 36.9% are nonresidents.
- 401,218 students are enrolled in Utah colleges.
- Enrollment in Utah has increased by 56.9% since 2010.
- Between 1970 and 2010, enrollment increased by 213%.
- 59% of full-time students in Utah are female.
- 48.6% of students enrolled in Utah postsecondary institutions attend public schools.
- Among all Utah residents enrolled in college, 11.4% leave the state to attend school.
College Enrollment in Vermont
Among students enrolled full-time in Vermont postsecondary institutions, 25.5% are state residents and 74.5% are nonresidents.
- 39,888 students are enrolled in Vermont colleges.
- Enrollment in Vermont has declined by 12.5% since 2010.
- Between 1970 and 2010, enrollment increased by 105.2%.
- 55.0% of full-time students in Vermont are female.
- 63.3% of students enrolled in Vermont postsecondary institutions attend public schools.
- Among all Vermont residents enrolled in college, 54.6% leave the state to attend school.
College Enrollment in Virginia
Among students enrolled full-time in Virginia postsecondary institutions, 75.1% are state residents and 24.9% are nonresidents.
- 546,280 students are enrolled in Virginia colleges.
- Enrollment in Virginia has declined by 5.5% since 2010.
- Between 1970 and 2010, enrollment increased 280.4%.
- 56.6% of full-time students in Virginia are female.
- 67.8% of students enrolled in Virginia postsecondary institutions attend public schools.
- Among all Virginia residents enrolled in college, 21.4% leave the state to attend school.
College Enrollment in Washington
Among students enrolled full-time in Washington postsecondary institutions, 83% are state residents and 17% are nonresidents.
- 311,068 students are enrolled in Washington colleges.
- Enrollment in Washington has declined 19.9% since 2010.
- Between 1970 and 2010, enrollment increased 111.5%.
- 57.3% of full-time students in Washington are female.
- 86.0% of students enrolled in Washington postsecondary institutions attend public schools.
- Among all Washington residents enrolled in college, 25.8% leave the state to attend school.
College Enrollment in West Virginia
Among students enrolled full-time in West Virginia postsecondary institutions, 56.2% are state residents and 43.8% are nonresidents.
- 132,923 students are enrolled in West Virginia colleges.
- Enrollment in West Virginia has declined by 12.8% since 2010.
- Between 1970 and 2010, enrollment increased 141.4%.
- 56.5% of full-time students in West Virginia are female.
- 53.7% of students enrolled in West Virginia postsecondary institutions attend public schools.
- Among all West Virginia residents enrolled in college, 17.5% leave the state to attend school.
College Enrollment in Wisconsin
Among students enrolled full-time in Wisconsin postsecondary institutions, 71.9% are state residents and 28.1% are nonresidents.
- 316,129 students are enrolled in Wisconsin colleges.
- Enrollment in Wisconsin has declined by 17.7% since 2010.
- Between 1970 and 2010, enrollment increased by 90.1%.
- 56% of full-time students in Wisconsin are female.
- 82.7% of students enrolled in Wisconsin postsecondary institutions attend public schools.
- Among all Wisconsin residents enrolled in college, 21% leave the state to attend school.
College Enrollment in Wyoming
Among students enrolled full-time in Wyoming postsecondary institutions, 63.8% are state residents and 36.2% are nonresidents.
- 29,971 students are enrolled in Wyoming colleges.
- Enrollment in Wyoming has declined by 21.7% since 2010.
- Between 1970 and 2010, enrollment increased by 151.6%.
- 52.4% of full-time students in Wyoming are female.
- 96.7% of students enrolled in Wyoming postsecondary institutions attend public schools.
- Among all Wyoming residents enrolled in college, 26.9% leave the state to attend school.
International Student Population & Enrollment Statistics
International enrollment for 2021 declined significantly due to COVID-related travel restrictions.
- In the 2020-2021 academic year, 1,057,188 international students enrolled in U.S. postsecondary institutions.
- 70.77% of international students studying in U.S. postsecondary institutions were from Asia.
- Among Asian international students, 38.7% were from China and 35.9% were from India.
- Relative to 1980, enrollment numbers among Asian international students increased by 690.5%.
- 4.95% of international students were from the Middle East or North Africa.
- International students from more than 30 countries studied in the U.S. in 2022-2023.
- 8.5% of international students were from Europe.
- 7.8% of international students were from Latin America.
- 5% of international students came from Southeast Asia (including Indonesia).
- 4.7% of international students were Sub-Saharan African.
- 2.6% of international students were Canadian.
- 0.43% of international students were Australian.
Study Abroad Enrollment Statistics
Nearly 350,000 students studied abroad in the 2018-2019 academic year; students are most likely to study abroad over a summer, and women are more than twice as likely to study abroad compared to men.
- In 2019-2020, 162,633 U.S. college students studied overseas, 67.4% of them were women.
- 42.7% of study-abroad students travel overseas during their junior year.
- 38.6% of study abroad students travel during a summer term.
- 30.7% of study abroad students study overseas for one (1) semester.
- 19.3% of study abroad students stay for a term of eight (8) weeks or less; 0.2% remain for a full calendar year.
- 55.7% of all study abroad students travel to Europe.
- American students are more than 58.1% more likely to study in Europe as they are in any other host region.
- 13.8% of study-abroad students travel to Latin America; 11.7% travel to Asia.
- In 10 years, the number of students studying abroad decreased 33.3%.
- 68.7% of study abroad students identify as white.
- 10.9% of study abroad students identify as Hispanic; 8.9% identify as Asian or Pacific Islander.
- 0.6% of study abroad students remain in North America (includes Canada and Antarctica).
Sources
- United States Census Bureau, Current Population Survey
- National Center for Education Statistics (NCES), Digest of Education Statistics
- National Student Clearinghouse Research Center, Current Term Enrollment Estimates
- NCES, Integrated Postsecondary Education Data System
Link nội dung: https://studyenglish.edu.vn/the-number-of-students-attending-a97545.html